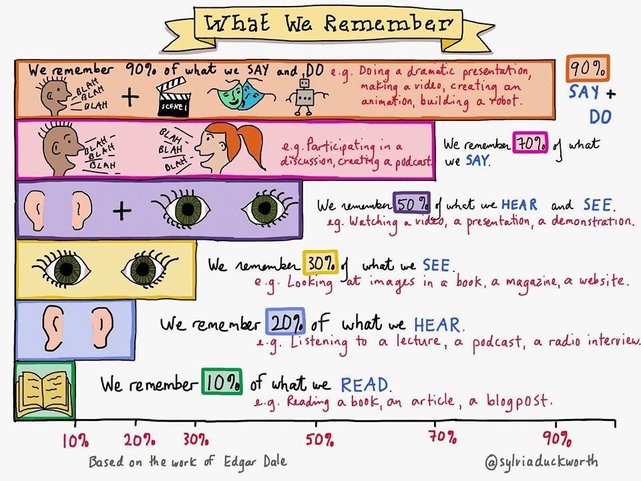
 Dr. Bobbe Baggio presents a very strong case for the use of effective graphics to promote learning through the visual perceptions She provides many usable and practical tips. A piece of knowledge about brain function that I had heard before that Baggio reiterates is the fact that the brain experiences cognitive overload. Too much is too much = the brain shuts out or dumps excess information. Either it ignores the over stimulation and the information never makes it into short term memory, or the brain puts unused information into cold storage, which makes it the most difficult to retrieve. Visual information, or graphic design inputs, can be just as overwhelming to the eye, and therefore the brain, as a page full of words. As I was perusing various twitter feeds, I ran across an infographic that connects Baggio’s information to Clark’s ideas to some of the digital technology with which Cohort 12 is experimenting to my still vague notion of where I want to take my Driving Question for the next phase. Indulge me while I work it out! https://pbs.twimg.com/media/DDPvi0BXUAAIMsk.jpg Baggio is saying that roughly 80% of the population learns visually. The infographic suggests we need to move beyond that to maximize retention. So add an additional audio layer from our cohort’s experimenting with various screencasting tools that allow for sound overlays. This moves us up to 50% retention. Put those same tools in the hands of the students themselves, and they are saying and doing themselves. Say and Do = 90% retention. Enter Clark’s advice on technical training. A key idea on effective lesson design is to know your desired performance outcome. This is a specific task that the student will be able to do; it is a VERB followed by a MEASURABLE TASK. Say and do. Clark also advises that within the structured lesson design there is supporting information provided with information displays and also a key lesson task that consists of practice exercises. It is also referred to as remember and apply. My previous driving question was to explore the impact of free, voluntary reading (pleasure reading) on reading proficiency in middle school students. The results of my action research showed me that increasing pleasure reading time as a single factor was not as effective as it should have been. One hypothesis as to why my results varied so drastically from the results I found in my literature reviews is that my population has specific qualities and needs. Using the SITE model helps understand these learners. 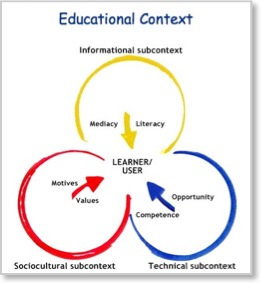 My student population is about 65% special needs or at-risk. Many of them face significant obstacles to reading proficiency. Some have never mastered learning to read, yet they are at the stage in school and life where they need to read to learn. Here the idea of mediacy enters. Mediacy is described by Paul Strassmann as, "the ability of individuals to successfully cope with communications in their civilization." Literacy and mediacy working together can help them succeed. Another significant obstacle for my students are affective (emotional domain) perceptions. Anxiety, depression, frustration from learning difficulties often color their perception of school in general and of learning tasks. In the SITE model, paying attention to these influences would be understanding their sociocultural motives and values. As Baggio notes, positive graphics can be a powerful tool to influence the affective perceptions of students. Enter the SITE model’s technical subcontext. Perhaps digital resources could be used to support their reading. Some examples of text readers and voice to text I found while following a weekly twitterchat ( #engchat, #edhat, #sschat): Chrome Speakit!, Announcify, and Read & Write for Google.  Chrome SpeakIt!  Announcify  Read & Write for Google My concept of my capstone project is evolving to include an audience that is partly students and partly other educators. I am envisioning a resource page for the students that is visually alluring and provides digital reading support resources. Other parts of the capstone pages would be directed at fellow teachers, especially those who have a need to support learning outside of class time. Essentially, it would provide research, suggestions, and resources. My teaching context is that of independent studies. Often I ask how I can assist my students from afar. They are at home, I am at school. I know other teachers at my site struggle with the same question. Likely, many teachers in many teaching contexts would also benefit. Both the student page and the teacher page fill this need.
“How can digital resources be leveraged to support reading success for at-risk & special needs students?”
6 Comments
Nai
6/27/2017 09:51:22 pm
The infographic reminded me of two techniques I learned in my first year of teaching from Fred Jones called "Say See Do" and VIPs (visual instructional plans). I had a great reaction when I used this strategy because students followed along, they were seeing what I was doing, and hearing what I was talking about so they could connect the two, and then they were doing it themselves. Baggio talked about how watching television mute or listening to the television from another room are never going to be as good as seeing the pictures and hearing it. Clark discusses how application level of learning procedures is better than rote memory. I think this fits perfectly with the Say See Do so that what is being learned goes into their long term memory at some point.
Patrick
6/28/2017 08:30:30 am
I like how your capstone is evolving to fill a "gap" in the research you conducted. You know your results were different than expected, but instead of chalking it up to structural limits of your study, you are moving into building a bridge to get students like yours to where research says they should be. Talk about making a product that people need!
james
6/28/2017 12:00:45 pm
Nancy, 6/28/2017 12:07:38 pm
After reading your blog and what I know about art it really hits home. As I was trying to make sense of the 4 pillars with the google slides we are prompt to use, my teacher - student friendly radar was Beeping the whole time. TOO much data, not enough graphics. Mine overload... Even recorded voice vs personal voice can make a difference in the way information is received. When I get confused about things, I pop on over to your blog. You have a way of explaining things that is logical and clear. It helps me when things get wonky in my brain. I love info graphs, and tried my hand at sketch note keeping this last week - spoiler alert: I'm terrible. I can usually figure things out by doing them -- I can put together furniture from IKEA like nobody's business, but it really helps for me to see the picture of the finished product. I'm not entirely sure what type of learner I am because I tend to fall into all categories. However, seeing always help me. When things get confusing, I draw pictures. Visual learning is such a great way to support our students. Leave a Reply. |
Nancy JaminetArchives
December 2017
Categories |
 RSS Feed
